Contents
Project Overview
The USDA Food Access Research Atlas identifies census tracts where residents have limited access to affordable and nutritious food — commonly called "food deserts." This project focuses on census tracts adjacent to Carlsbad, California (San Diego North County) that are flagged as both Low Income (LI) and Low Access (LA) at 1 and 20 miles.
By comparing data from 2015 and 2019, the analysis tracks how food access conditions, poverty, demographics, and government assistance changed over a four-year period in this rapidly growing region.
What Makes a Food Desert?
The USDA defines a food desert as a census tract that is both:
- Low Income — Poverty rate of 20%+ or median family income at/below 80% of area median
- Low Access — At least 500 people or 33% of the population lives more than 1 mile (urban) or 20 miles (rural) from a supermarket
Food Access Atlas Maps
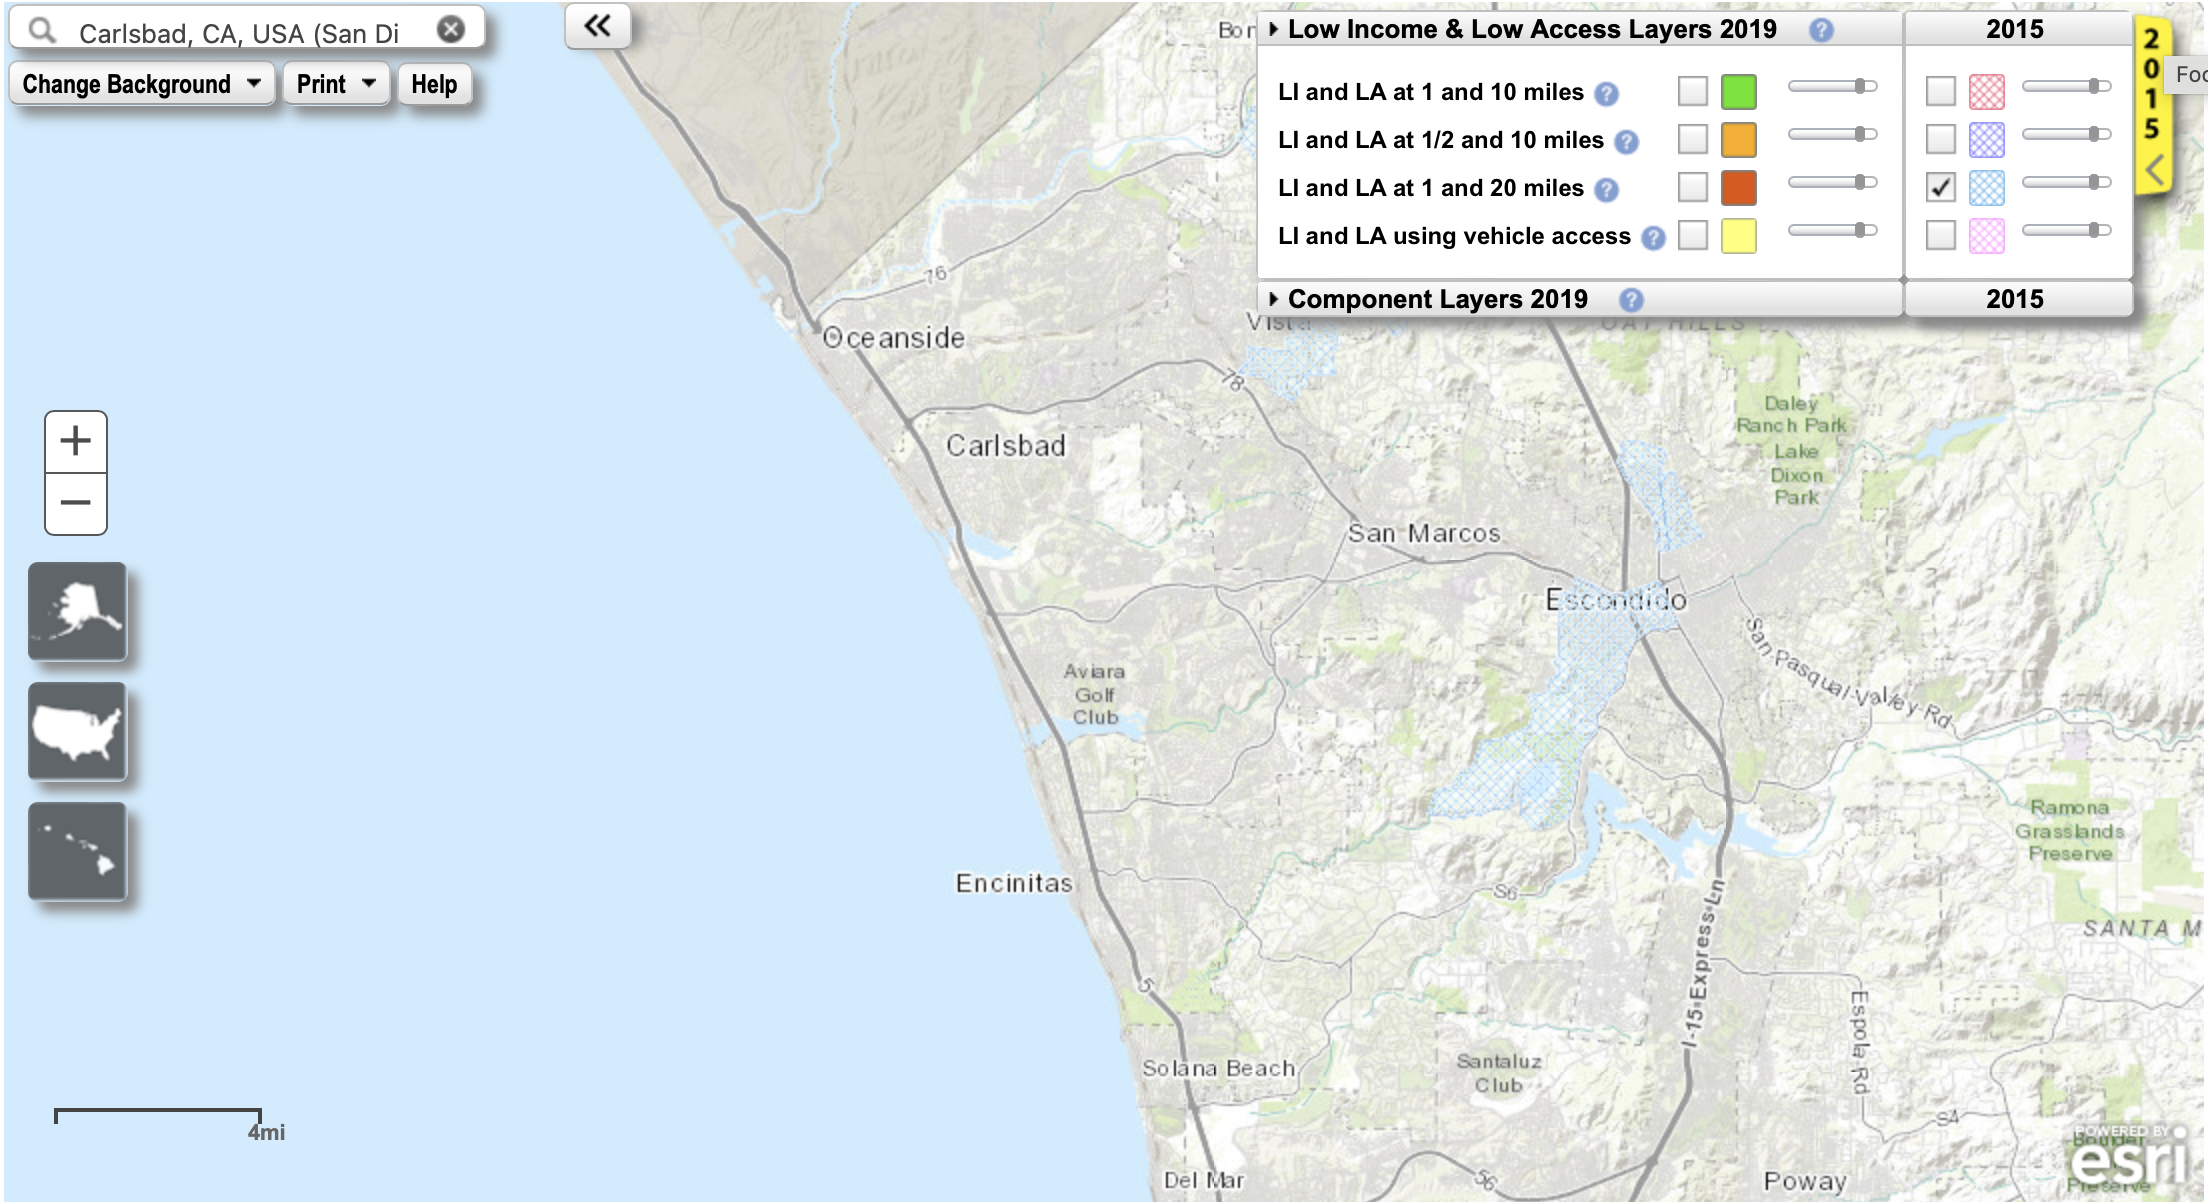
The USDA's interactive GIS atlas was used to identify the specific census tracts flagged as Low Income and Low Access in the Carlsbad, CA area for both study years.
2015 — Carlsbad Adjacent Tracts
Tracts: 06073019207, 06073020105, 06073019602, 06073020106, 06073020307
2019 — Carlsbad Adjacent Tracts
Tracts: 06073018603, 06073019207, 06073018610, 06073018609, 06073020021
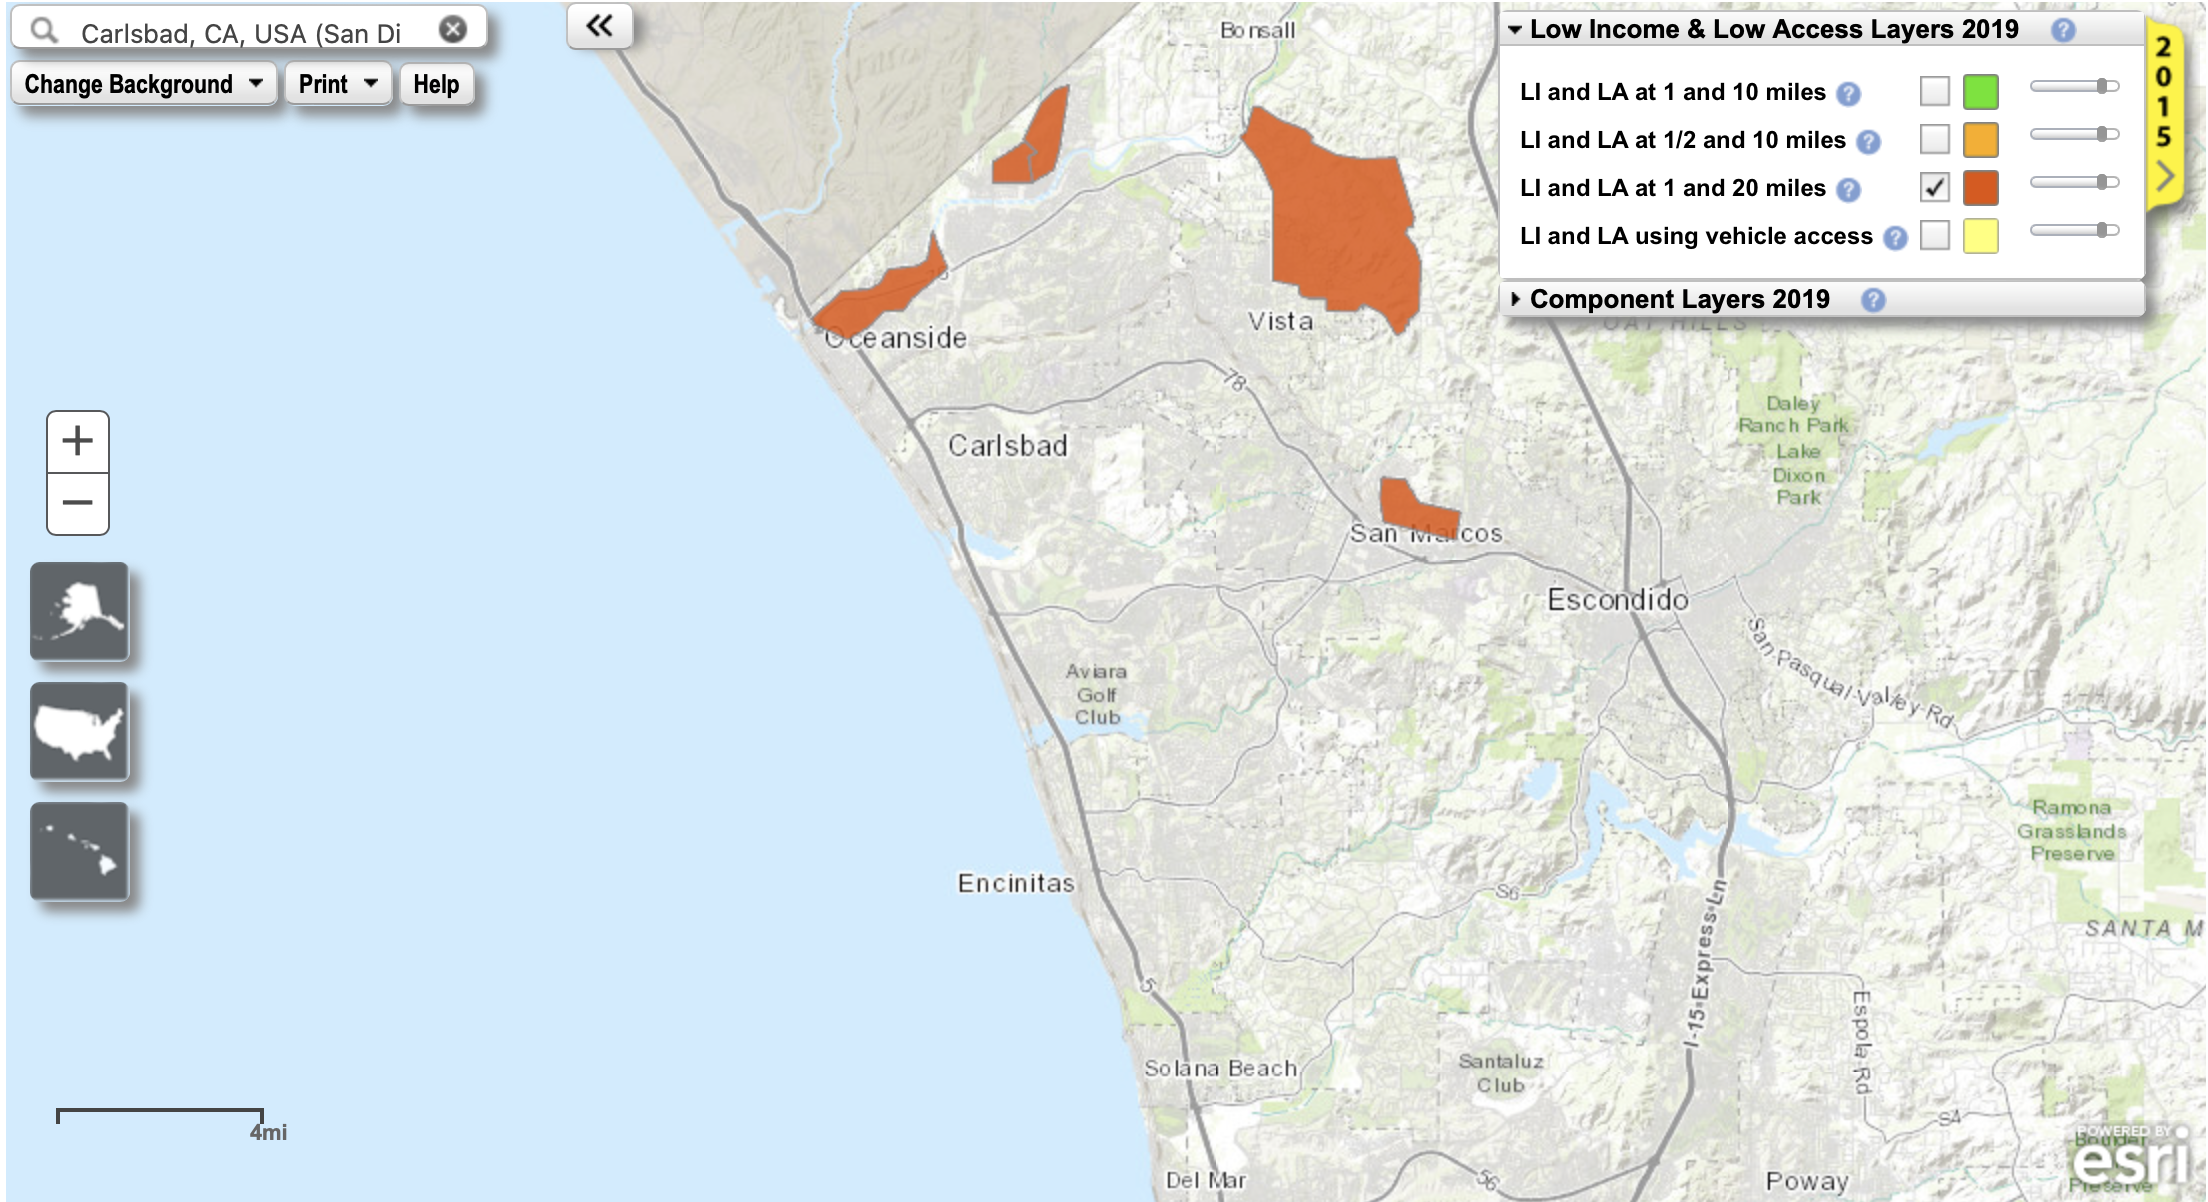
Note that while one tract (06073019207) persisted across both years, the specific tracts flagged shifted between 2015 and 2019 — indicating that food access conditions are dynamic and change with development and demographic shifts.
Data & Methodology
GIS Identification
Use USDA Atlas to find LI+LA tracts near Carlsbad for 2015 and 2019
Data Extraction
Filter 72,864-row national datasets to matching census tract IDs
Aggregation
Sum tract-level data into annual totals; average poverty rate and income
Comparison
Calculate deltas and percentage changes between 2015 and 2019
Data Source
The Food Access Research Atlas is published by the Economic Research Service (ERS) of the U.S. Department of Agriculture. Each row represents a census tract with 147 features covering population, income, access metrics, and demographic breakdowns.
- 2015 Dataset: 72,864 census tracts, 147 features
- 2019 Dataset: Same structure, updated measurements
- 31 features selected for analysis from the original 147
Variables Analyzed
Trends: 2015 vs. 2019
Aggregating the identified tracts into annual totals reveals significant shifts in the community composition of Carlsbad's food desert areas over four years.
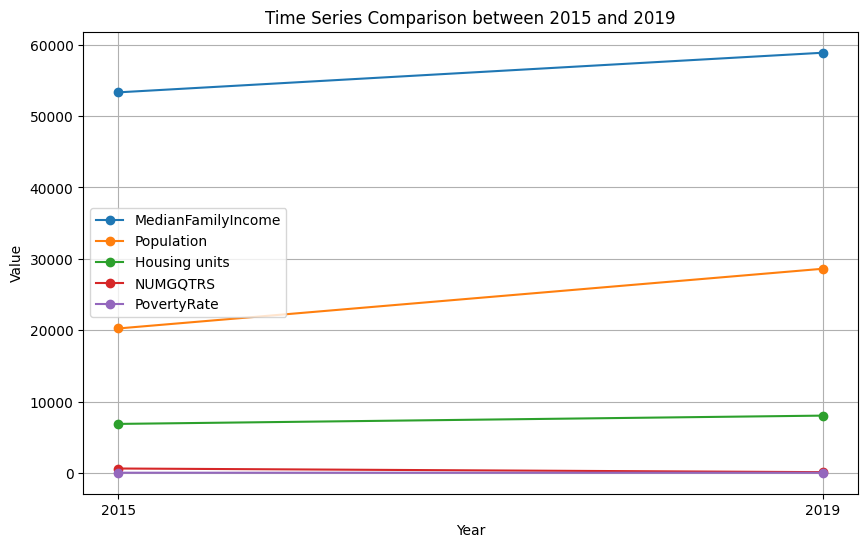
Time Series Comparison (2015 vs. 2019)
Line chart tracking median family income, population, housing units, group quarters, and poverty rate between the two study years. Population and income rose while poverty rate slightly decreased.
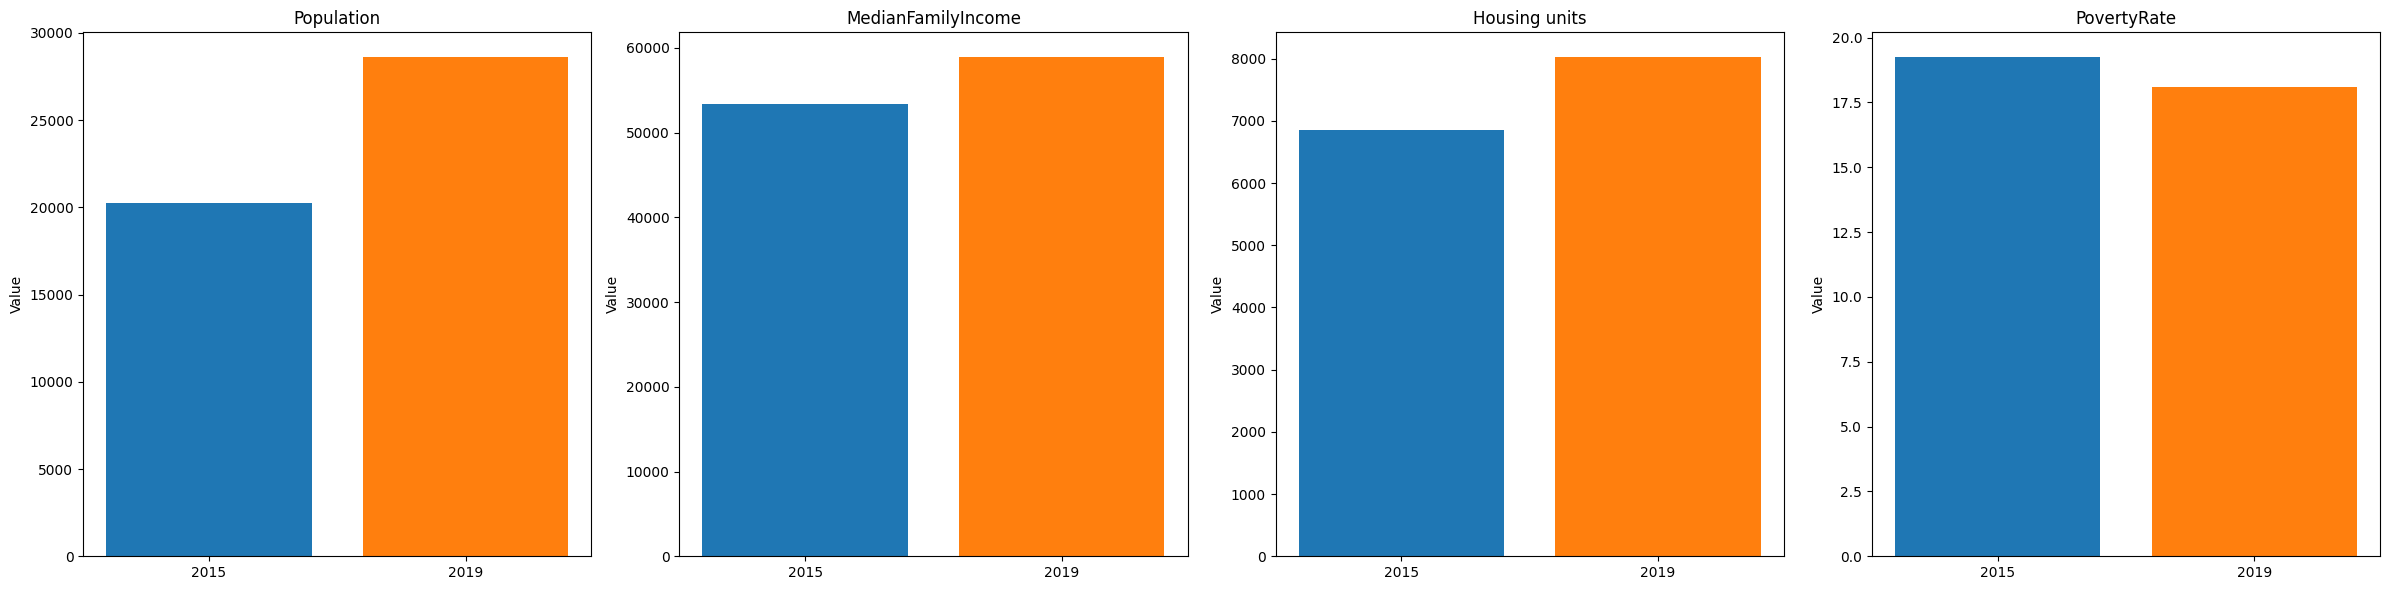
Key Tract Compositional Shifts
Side-by-side bar comparisons for population, median family income, housing units, and poverty rate. The area saw significant growth (+41% population, +17% housing) while the poverty rate marginally decreased.
Demographic Shifts & Vulnerable Populations
The analysis examines how the composition of food desert areas changed, with particular attention to children, seniors, and SNAP benefit recipients — the populations most affected by limited food access.
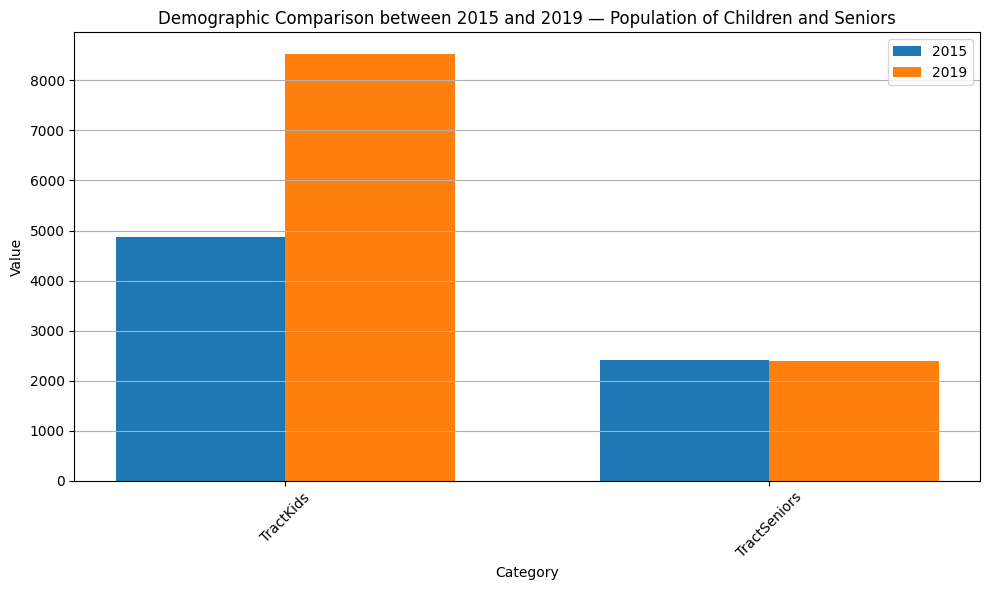
Children vs. Seniors in Food Desert Tracts
By 2019, 8,536 children were living in areas of extreme low food access — an increase of 3,657 children (+75%) from 2015. Senior population remained nearly flat (-0.8%).
In 2019, there were 8,536 children living in an area of extreme low food access. This was an increase of 3,657 children from 2015.
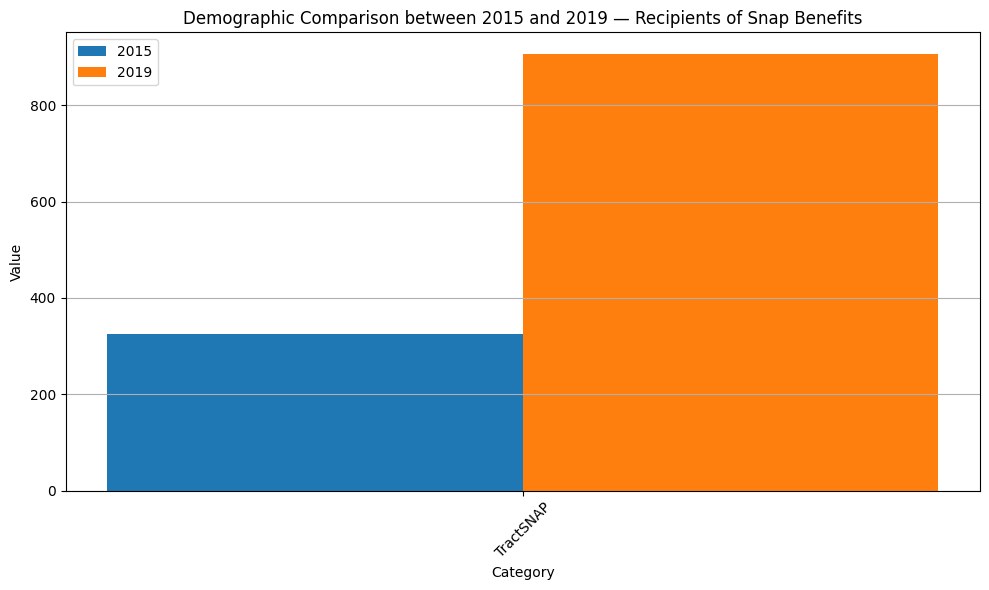
SNAP Benefits Recipients (2015 vs. 2019)
Housing units receiving SNAP benefits surged from 325 to 906 — a 179% increase — indicating growing food insecurity despite rising median income in the area.
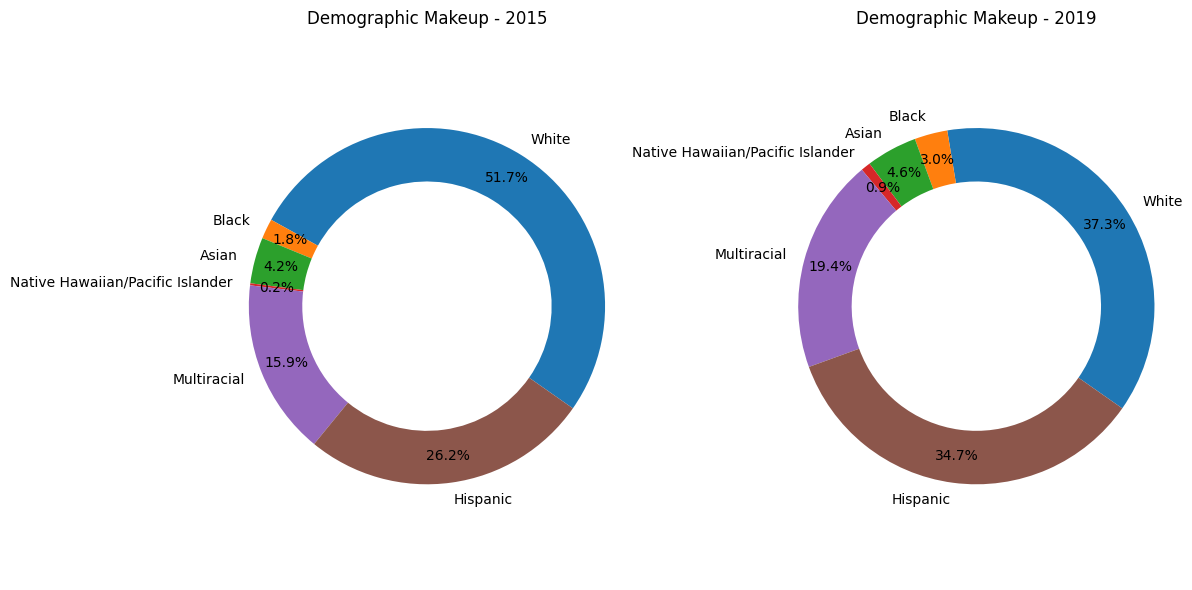
Demographic Makeup — 2015 vs. 2019
Donut charts comparing the racial/ethnic composition of food desert tracts. The most notable shifts include a 643% increase in Native Hawaiian/Pacific Islander residents, 164% increase in Black residents, and 112% increase in Hispanic residents.
Percentage Changes by Demographic Group
Key Findings
Despite rising income and falling poverty rates in the area, the number of people affected by food access challenges grew dramatically — with children and minority populations disproportionately impacted.
Primary Findings
- Rapid population growth in food deserts. The population across identified tracts grew 41% from 2015 to 2019, outpacing the development of food retail infrastructure.
- Children are the most affected group. An additional 3,657 children were living in low food access areas by 2019, a 75% increase that signals urgent need for intervention.
- SNAP dependence surged 179%. Even as median family income rose ~10%, the number of households on SNAP nearly tripled — suggesting growing income inequality within these tracts.
- Dramatic demographic diversification. Minority populations grew at rates far exceeding the White population (+16%), with NHOPI (+643%), Black (+164%), and Hispanic (+112%) communities increasingly concentrated in food desert areas.
- Food desert tracts shifted geographically. Only one tract (06073019207) appeared in both years, showing that food access is a moving target as communities develop.
Implications
- New grocery and food retail development is not keeping pace with population growth in North County San Diego
- Food access policies should prioritize areas with high concentrations of children
- The growing SNAP enrollment despite rising income points to widening inequality within census tracts
- Demographic shifts suggest that food access disproportionately affects communities of color in this region